Professional Portfolio
This portfolio showcases a range of professional and academic work—spanning recent GIS-driven projects to earlier work in lighting design and physical science. My experience covers key platforms such as ArcGIS Pro, Field Maps, and Adobe Illustrator, and blends rigorous spatial analysis, cartographic design, and project management across multiple public agencies and private sector companies.
I began working with GIS during the transition from ArcMap to ArcGIS Pro, and have steadily kept pace with the shift toward cloud-based and web-app workflows. Whether mapping light-pollution patterns, performing spatial analyses for conservation and planning, or crafting visual narratives of physical systems, my aim has been to use geographic thinking to support land management, conservation, and effective decision-making.
I look forward to applying these skills to further the mission of protecting public lands and advancing the power of mapping and data storytelling in conservation and planning.
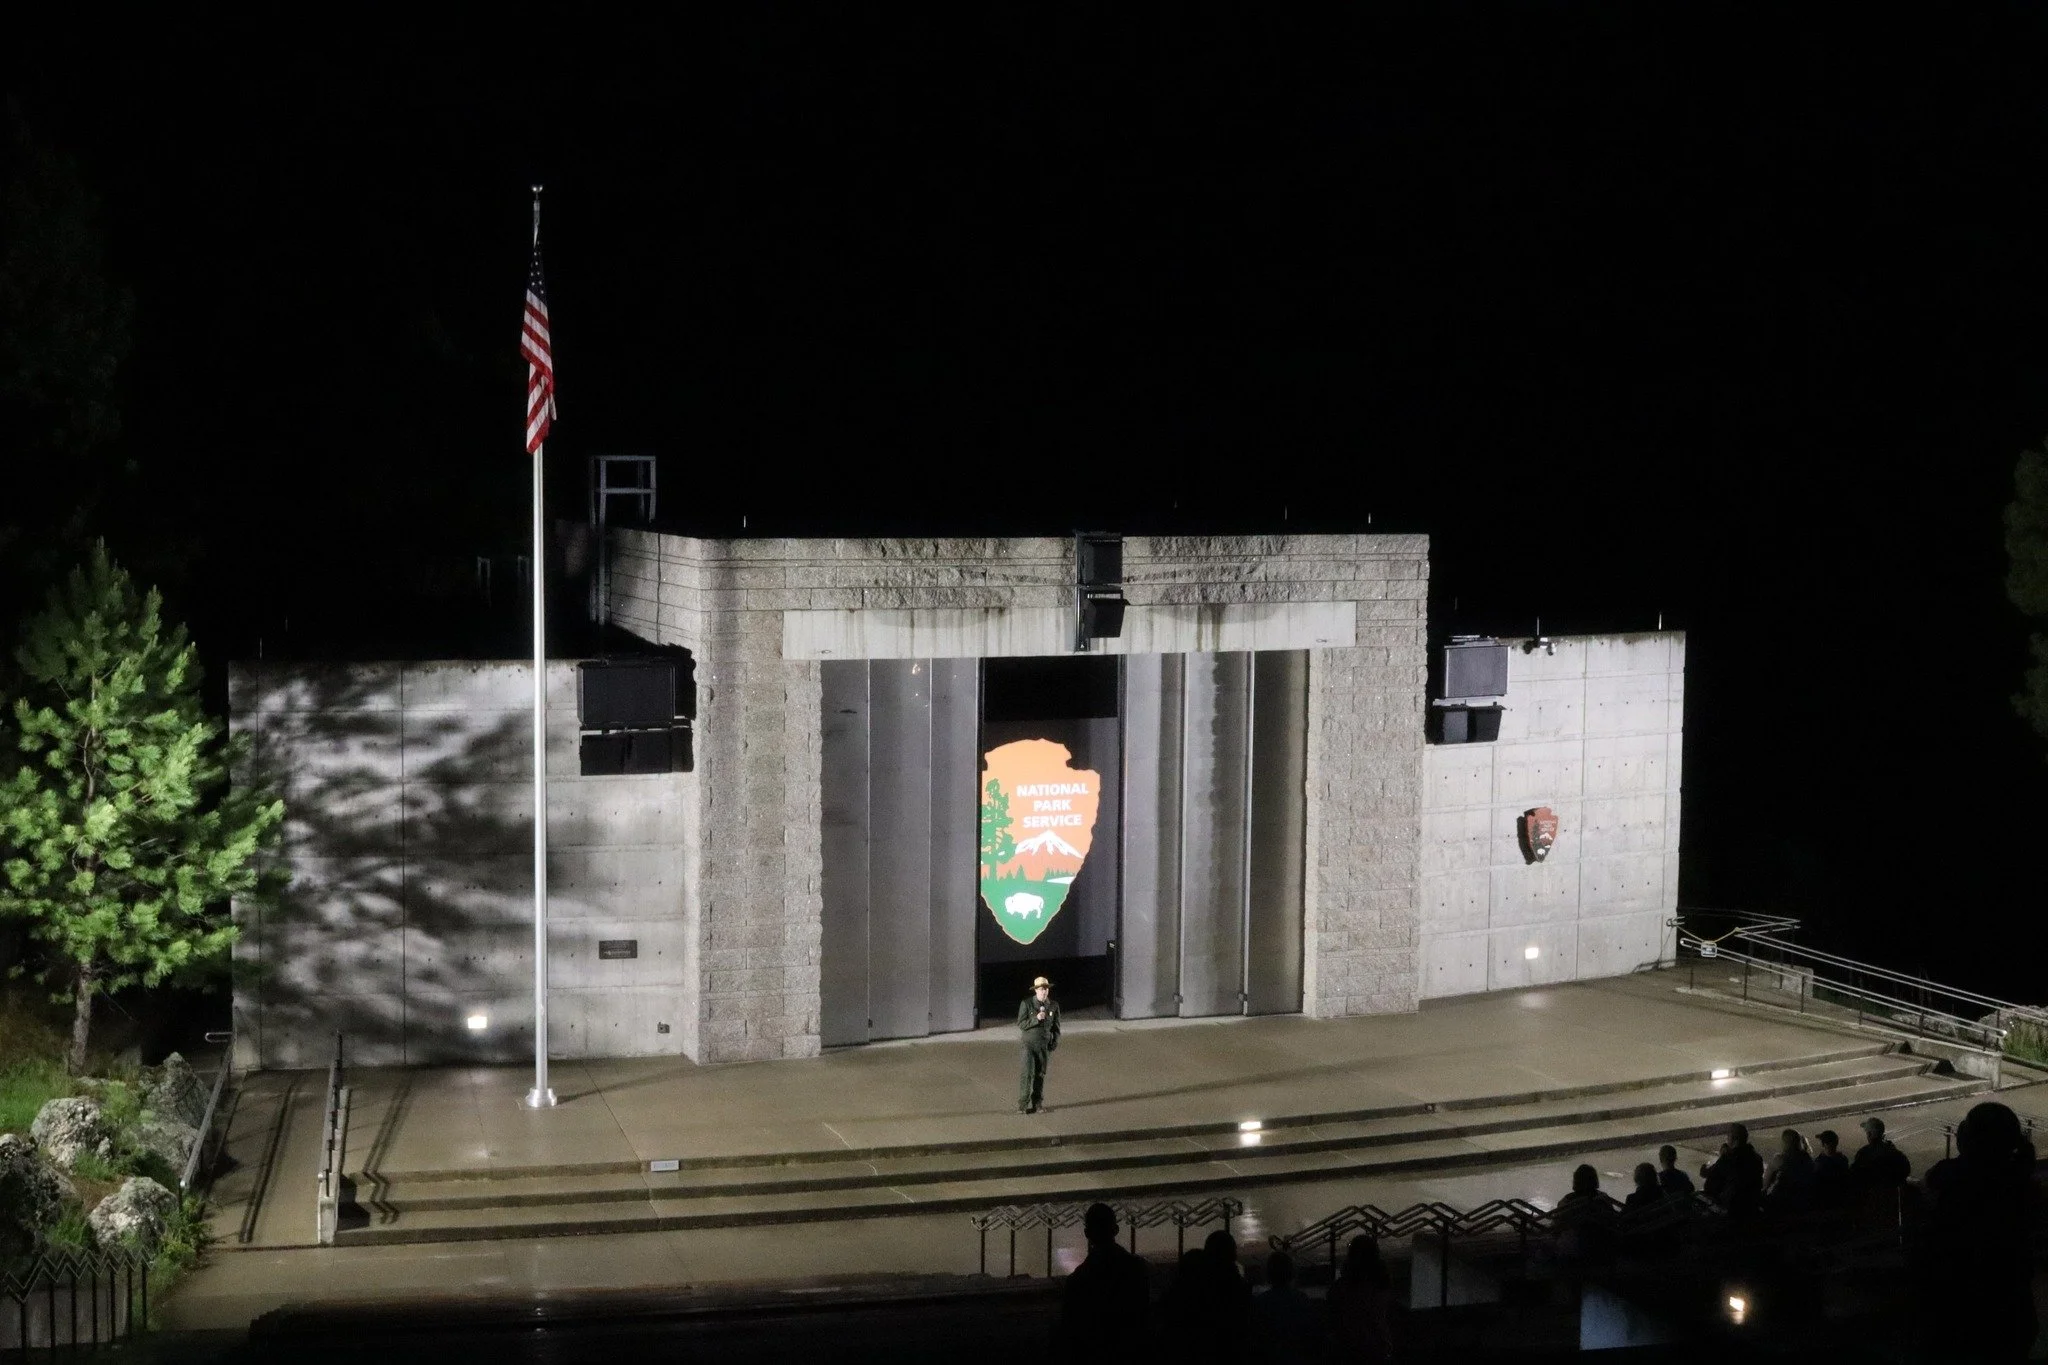
Photo credits: NPS
Mount Rushmore stage lighting retrofit project
This May, the National Park Service partnered with Musco Sports Lighting and the National Park Foundation (NPF) to retrofit and modernize the stage at Mount Rushmore National Memorial. I am the project manager for this partnership and act as the liaison between park units and Musco/NPF. At Mt. Rushmore, six controllable LED fixtures replaced 48 aging halogen lights resulting in a nearly 90% increase in energy efficiency. This is the first of nine projects between Musco and NPF in parks across the country from Hawaii to North Carolina taking place over the next three years.
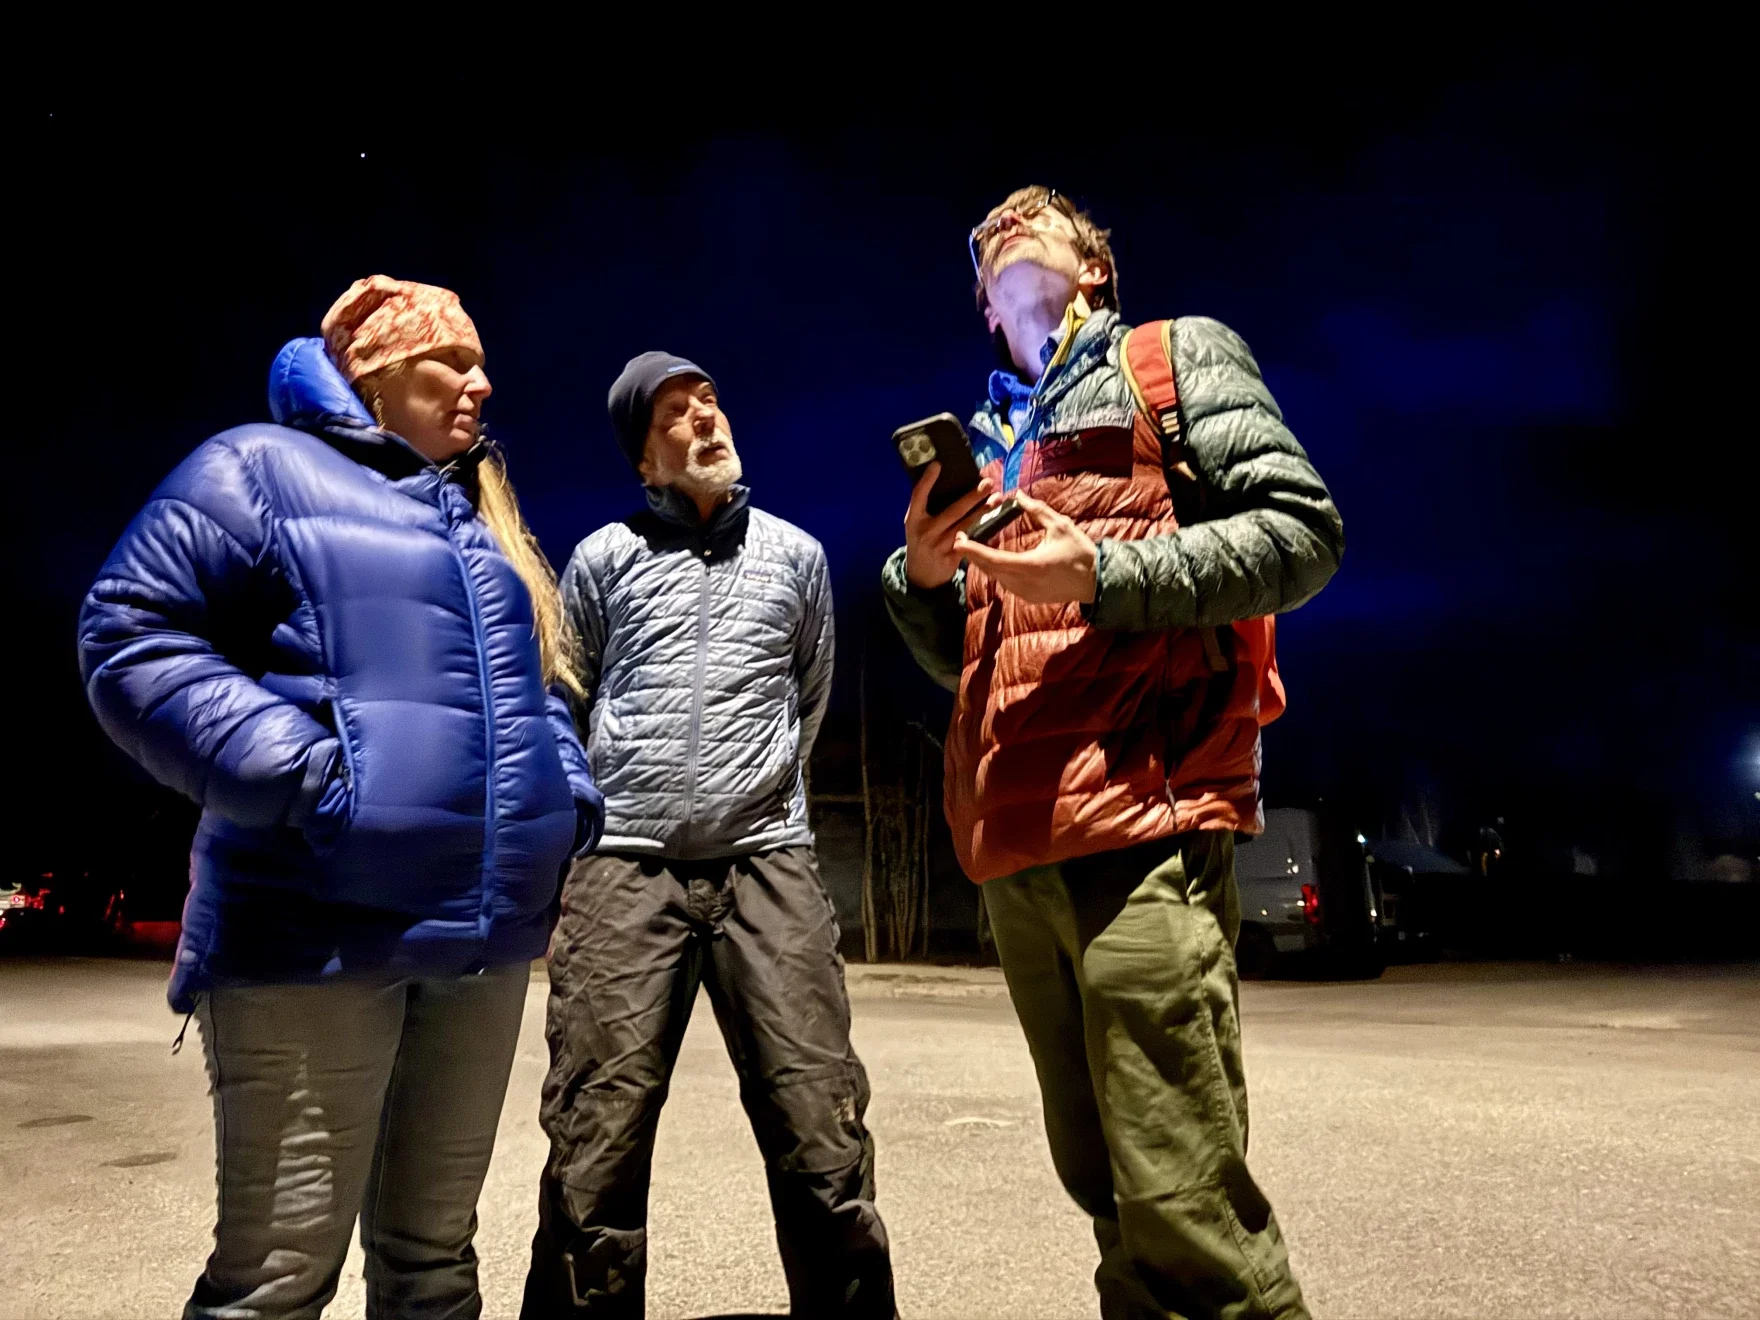
Ben Banet, right, holds a sensor beneath a light in a Leadville parking lot. He’s showing volunteers how to take an inventory of the public lights in the city. (Rachel Cohen, KUNC)
Leadville, CO Dark Sky Mentorship
In 2024-25, I partnered with DarkSky Colorado to provide mentorship to Leadville, CO in their pursuit of DarkSky Community status. Receiving their designation as a dark sky friendly community will enhance astrotourism and sustainable recreation. As Leadville transitions away from their historical mining economy, alternative forms of economic development are welcome. I wrote the towns Lighting Ordinance to help limit light trespass and reduce skyglow and assisted with getting the citizens of the town started on the town-wide lighting inventory.
In 2025-26, I am working with the town of Lyons, South Park National Historic Area, and Leadville again.
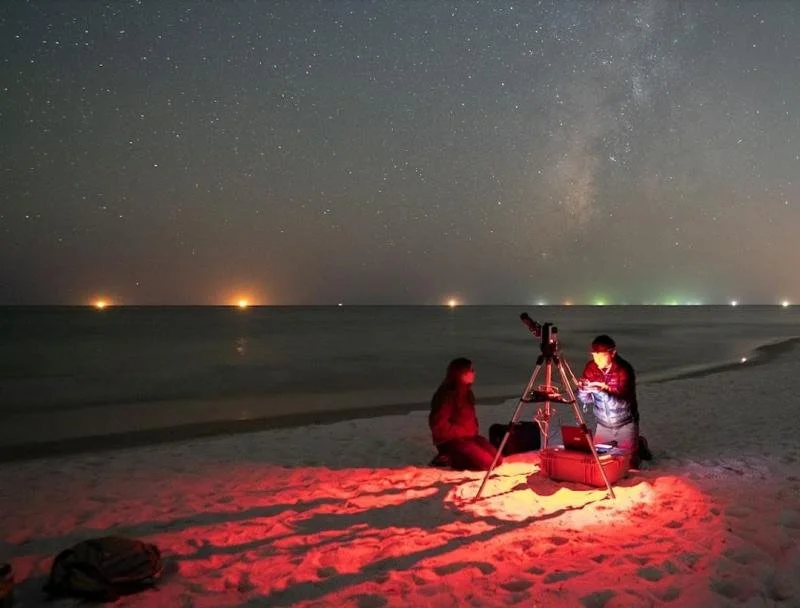
Data collection with the Night Sky Metrics Spectroscope in Bon Secour National Wildlife Refuge, Alabama. Oil rigs in the Gulf are visible along the horizon.
Deepwater Horizon Project progress Report
In 2024, I wrote this progress report to summarize the first two years of work on the Deepwater Horizon Night Sky Restoration Project for the National Park Service. I summarize what data had been collected so far with our three various camera systems, created maps of the study area in ArcGIS Pro, outlined what we hoped to collect in the future, and generated tables and figures. The report was compiled in LaTeX. It is hosted on NOAA’s DIVER portal and viewable as a PDF below.

Screenshot of a lighting inventory in ArcGIS Online showing downtown Pensacola, Bayfront Parkway, the Community Maritime Park, and Pensacola Bay Bridge. All these lights are visible from the Fort Pickens area of Gulf Islands National Seashore and were collected on multiple field trips to Florida between 2022 and 2024.
NPS Lighting Inventory Field Data Collection Apps
As a Scientist in the Parks intern in 2021-2022, I updated the Standard Operating Procedure for the NPS Lighting Inventory process to ArcGIS Pro from its former ArcMap and ArcCatalog workflow. I have used and refined this workflow extensively in my work at Gulf Islands National Seashore. Currently, I assist parks with setting up feature classes and templates to collect their own data on lights in the park to see if they are compliant with dark sky friendly lighting standards.
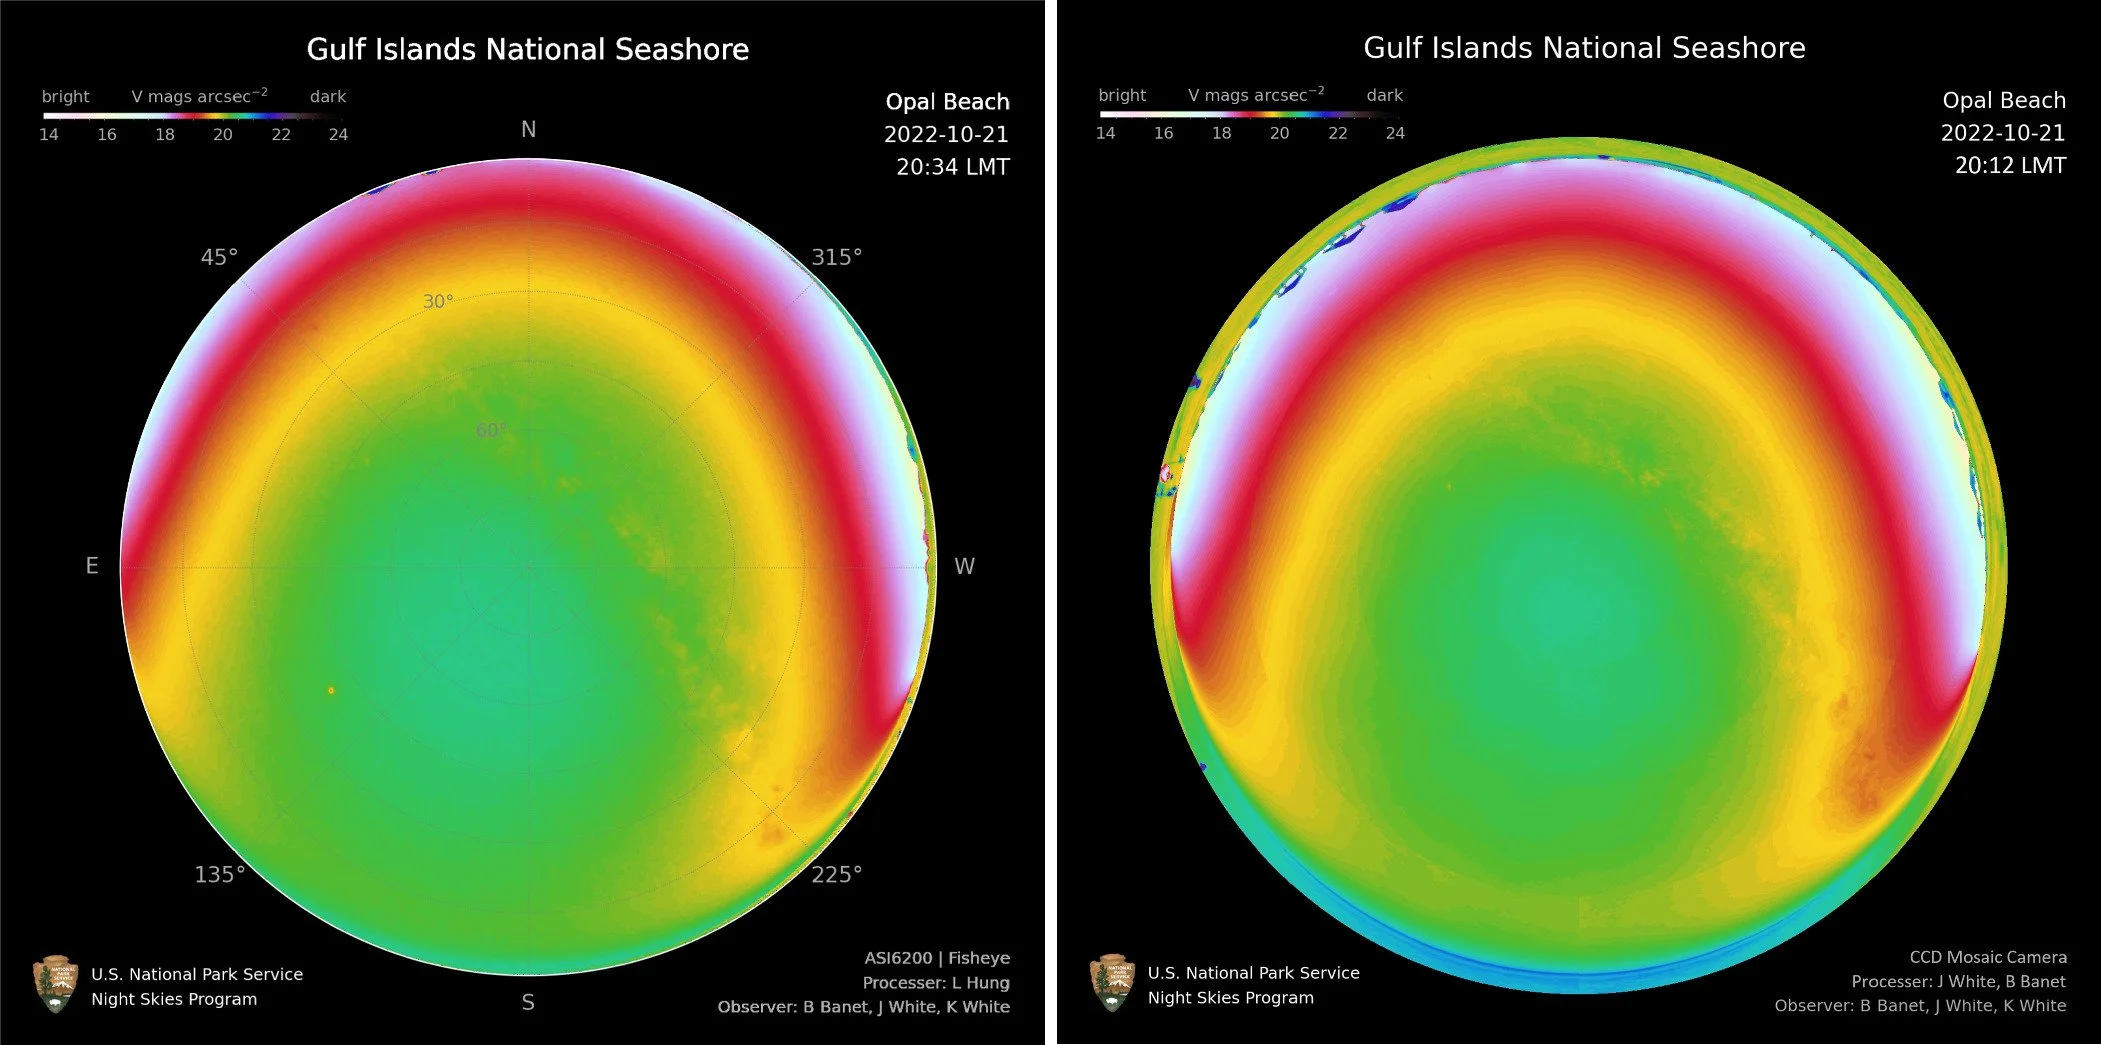
Fisheye image on the left and CCD image on the right
Fisheye Night Sky Imager
My NPS coworker, Dr. Li-Wei Hung, has been developing a new CCD camera system for calibrated night sky imagery that is more portable and capable of greater temporal resolution than the NPS CCD camera system that takes ~1 hour for a single image since it generates a mosaic of 45 images. I got to take the fisheye system to Gulf Islands NS and Bon Secour NWR for its first major field deployment and have assisted with calibration and hardware building out the NPS system of multiple cameras.
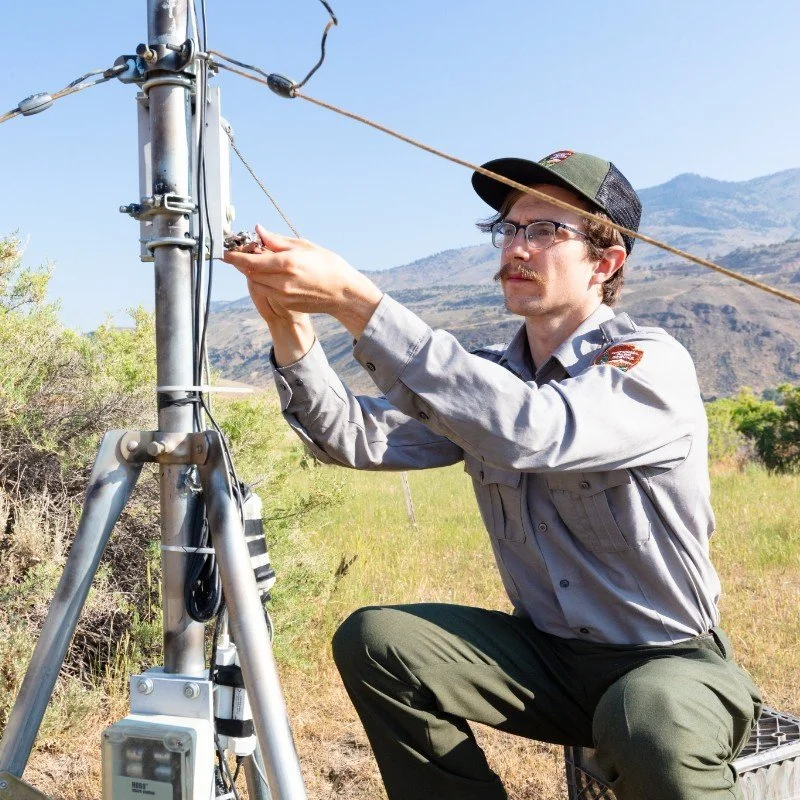
Yellowstone Physical science Technician
For two summers at Yellowstone National Park, I was the primary monitor on the park’s network of climate stations spread across an elevational gradient of roughly 4,000 ft across 30 miles. The stations measured wind speed, rainfall, soil moisture, temperature, humidity, and solar radiation. They were paired with camera traps that recorded both wildlife and snow depth on monitoring stakes that recorded temperature at different heights in the snowpack. All these data collection devices required maintenance and troubleshooting often in remote, difficult to access sites without cell service. Bison, elk, bears, and moose frequently interfered with station guy wires and frequent visits for data collection would allow for timely repairs and continuity of data collection if sites were damaged.
District 9 Bicycling Guide on arcgis online storymaps
I created this interactive story map using ArcGIS to explore and highlight the hundreds of miles of beautiful cycling routes in District 9. I used RideWithGPS to embed maps that had detailed cue sheets with important information for riders such as water, distance, elevation gain, parking and historical sites along the way.
Sample Bike Route from the Guide
Each of the routes in the District 9 Bicycling Guide are linked to a RideWithGPS page so cyclists can take their map on their smartphone when riding to see what turns or climbs are coming up and where they can get water and food or use the restroom

Caltrans Quarterly Reports Dashboard on arcgis online
This interactive ArcGIS Online Dashboard allows members of the public and stakeholders to view the current status of projects in their area of interest. I updated this every quarter with current status of projects and generated a number of internal applications for the organization.

Peddocks Island Map
As a Cartographic Technician at Boston Harbor Islands National Recreation Area, I got to create new maps of all the islands that had heavy visitor traffic. I used ArcMap, ArcGIS Pro, and Adobe Illustrator at various points in the production process.
I also generated highly detailed maps of land-based park units for the law enforcement staff to print on whiteboards at 3x5’ for incident briefings and planning of operations.
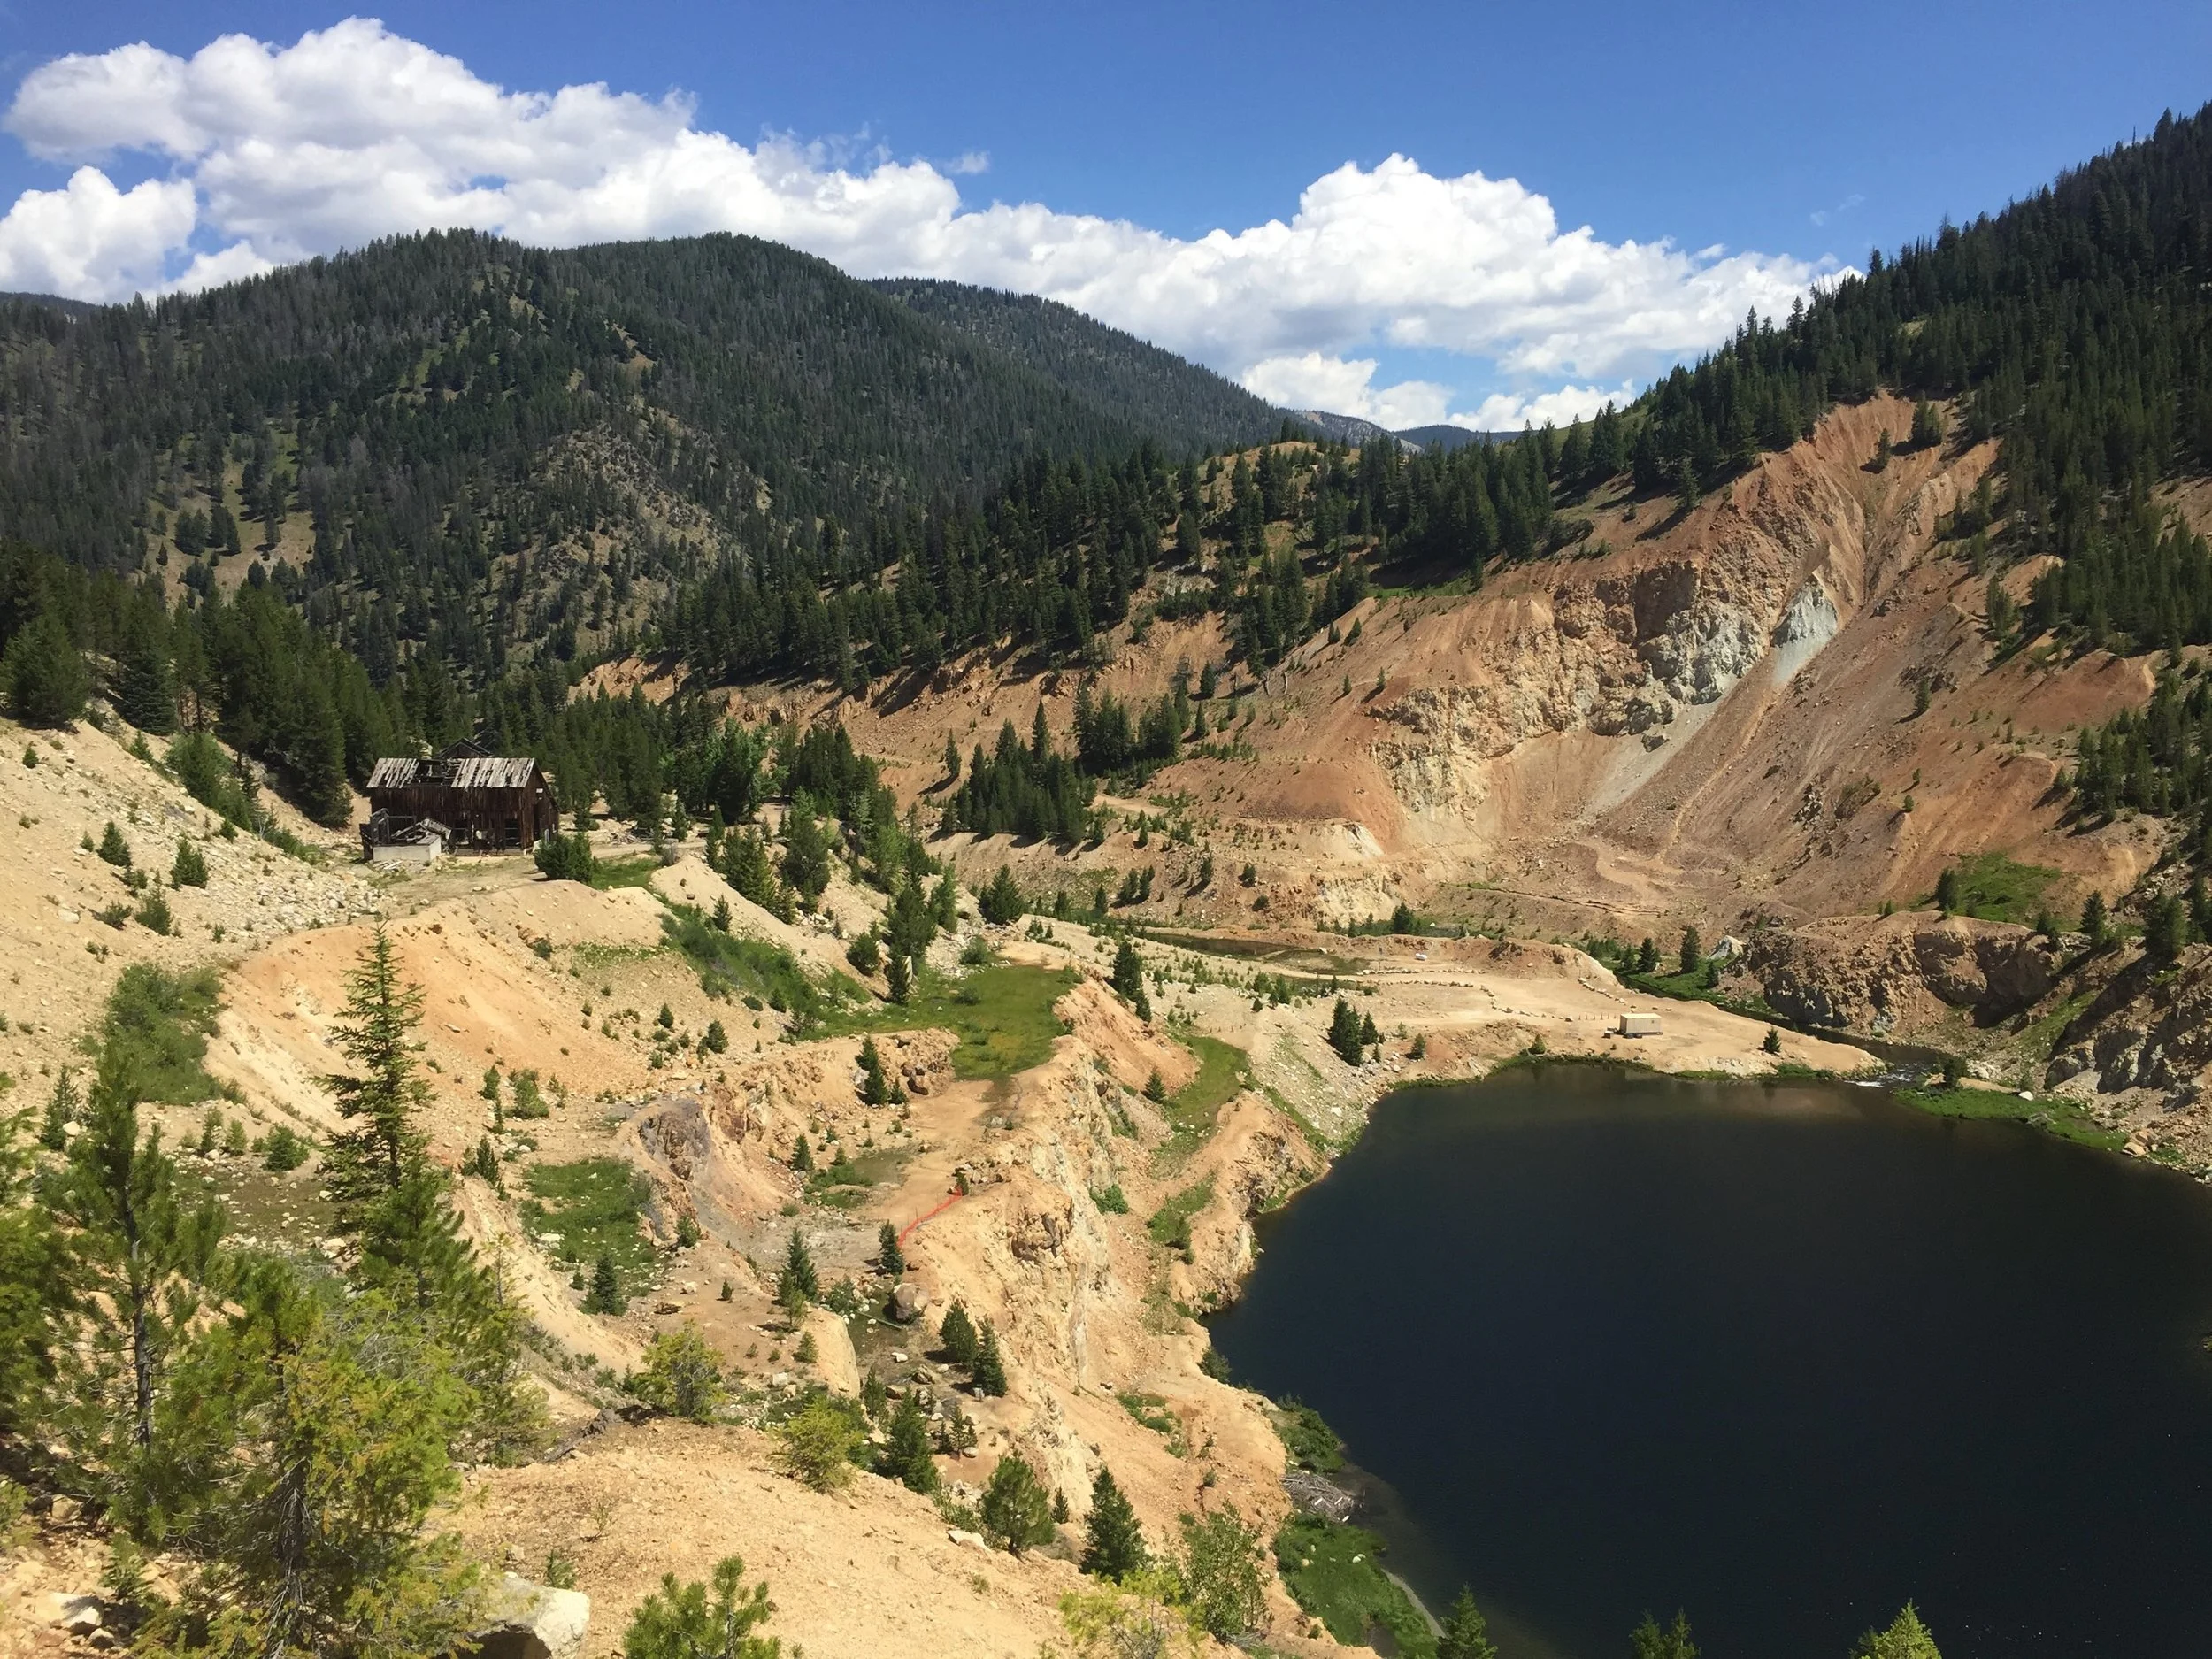
Stibnite- a historic gold mine that Perpetua Resources is trying to reopen
Stibnite Site Lighting Report
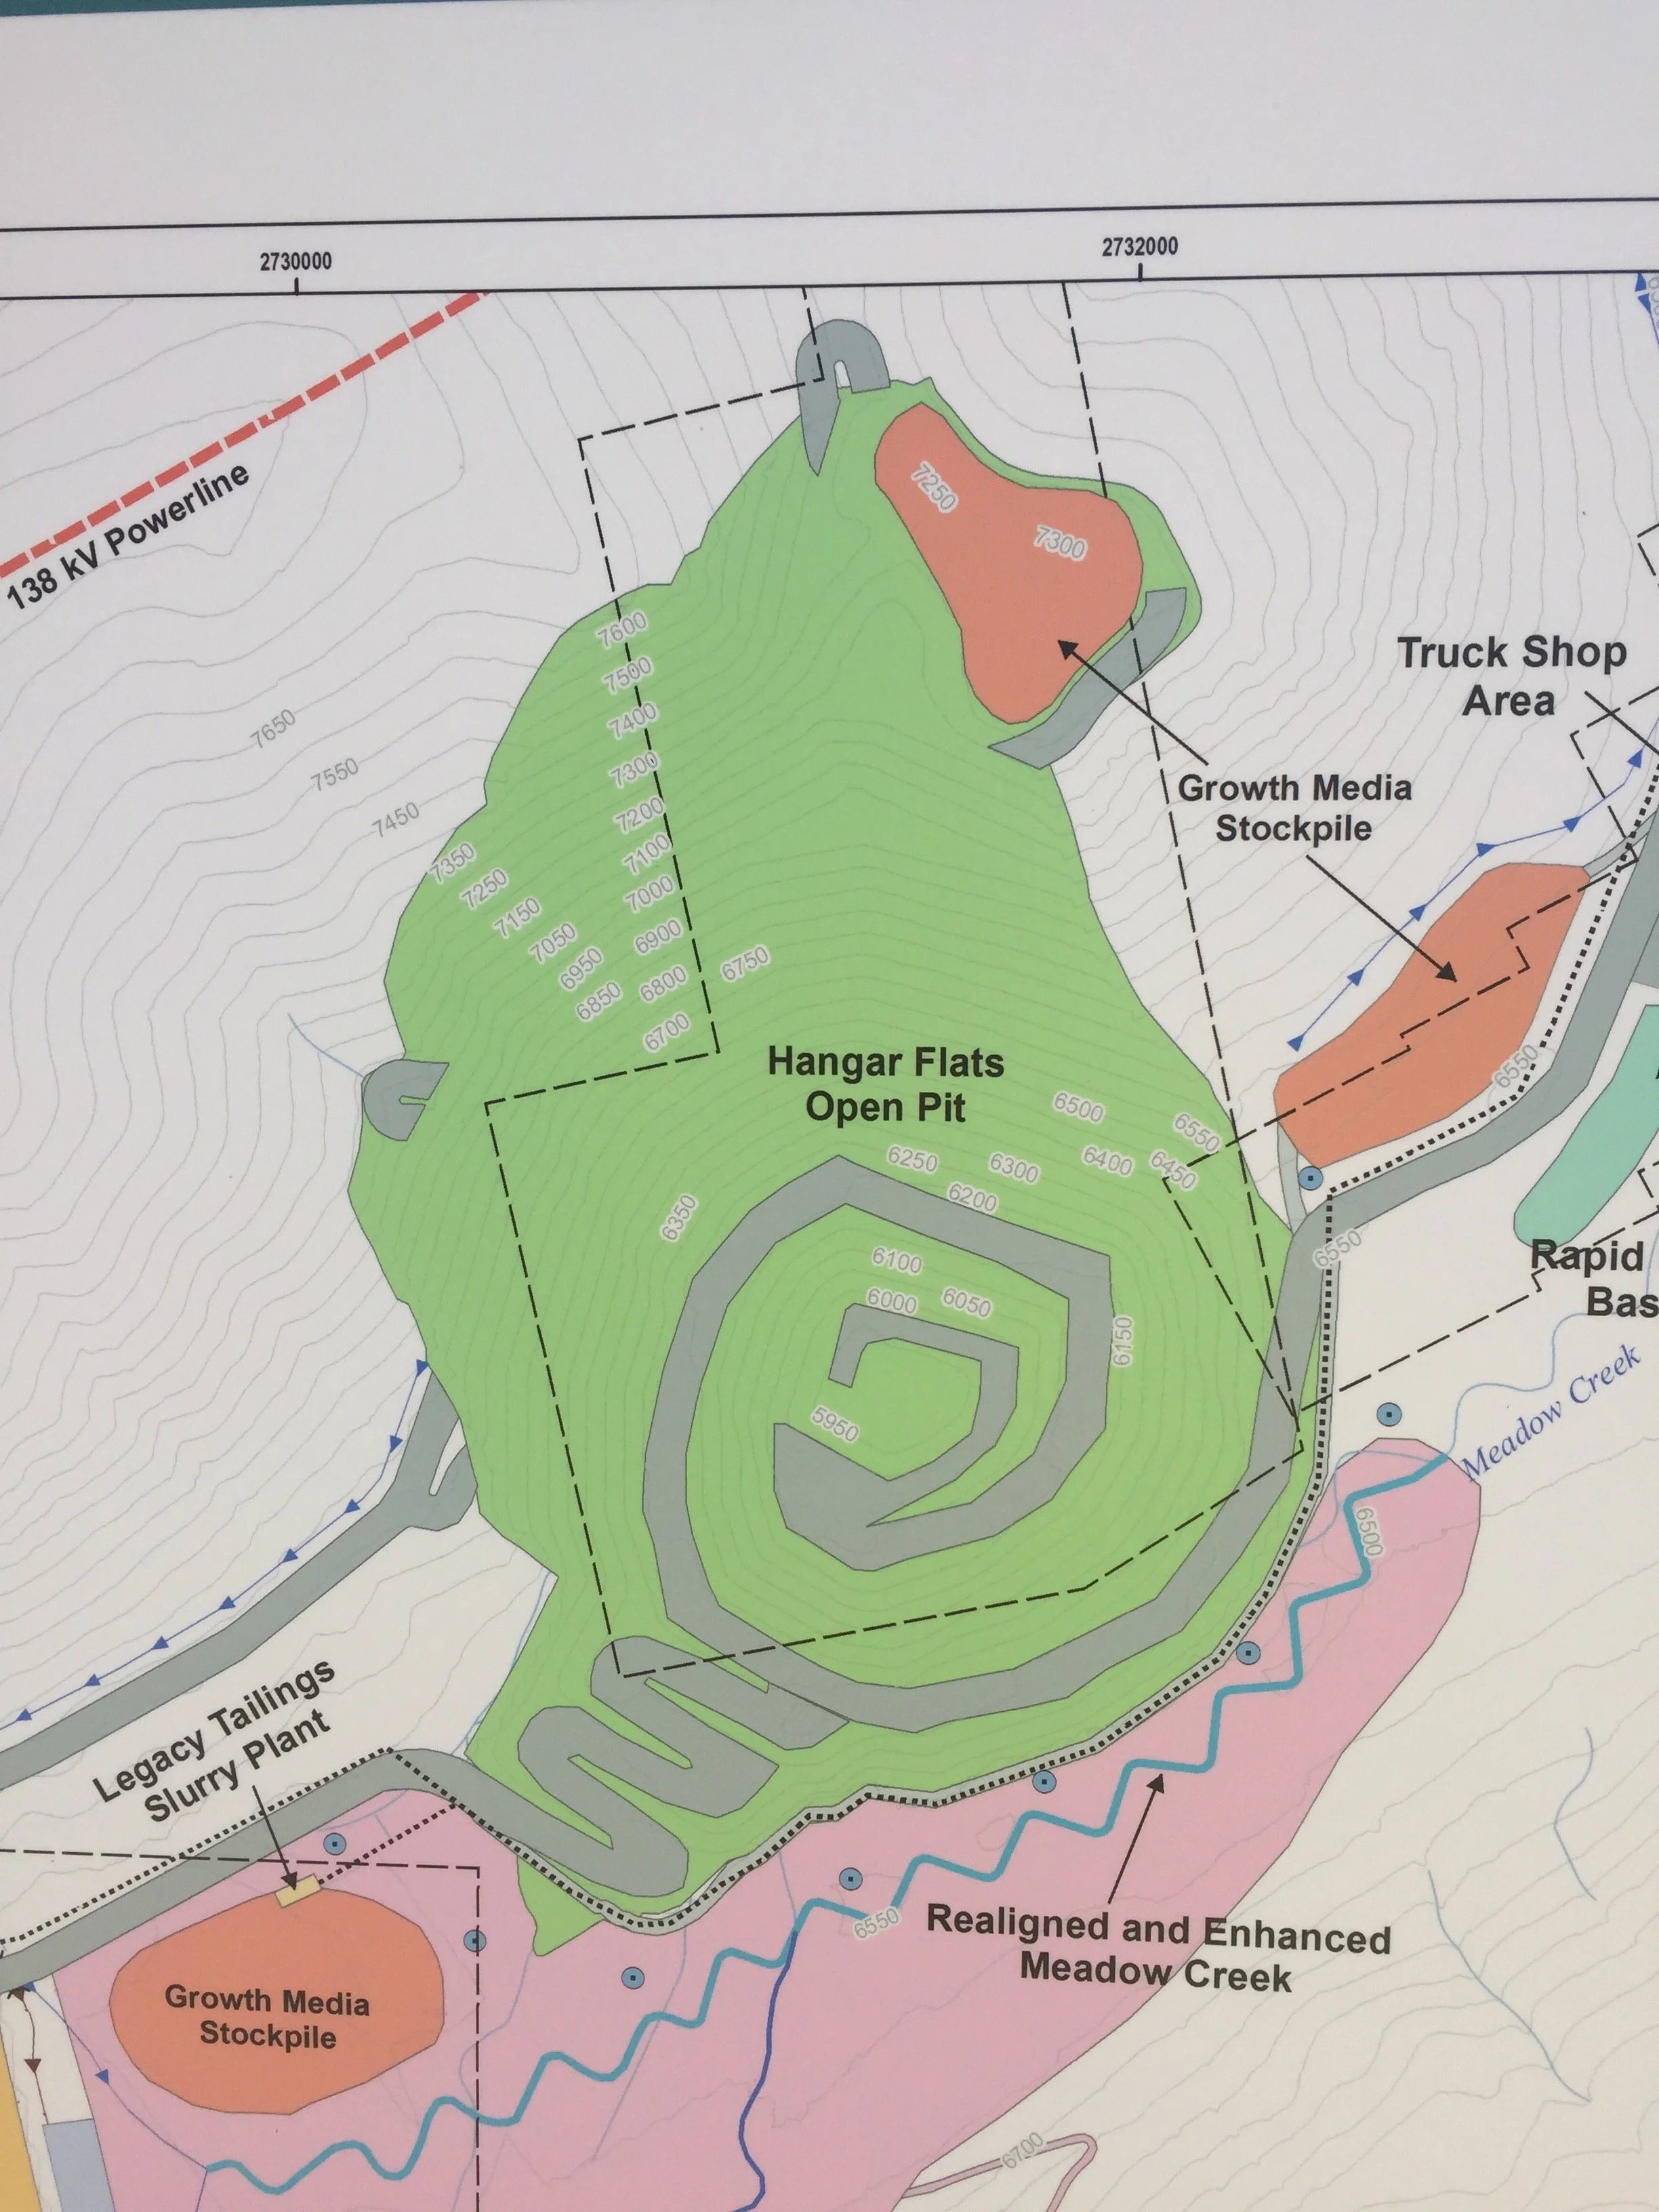
Midas Gold Inc (now Perpetua Resources) is in the process of applying for permits to restart a gold mining operation in Idaho. The site’s remote location is across a ridge from the Central Idaho Dark Sky Reserve and potential 24/7 mining operations pose a significant threat to the quality of Idaho’s night skies. To mitigate this threat, I developed a lighting plan modeled on best practices for worker safety while utilizing shielding and wildlife-friendly color temperatures. I presented my work at an Idaho Mining Conference in Boise, ID in 2018 and got overall positive reception from both industry and environmental groups. I drew on the cost saving benefits of more targeted lighting and the safety implications of reducing disability glare to make the issue more than a fringe environmental concern.
The poster below was presented in 2018 at the USC Undergraduate Research Symposium and summarized years of my undergraduate research on light pollution in National Parks across the west with Dr. Travis Longcore. It was during this time that I became aware of the Natural Sounds and Night Skies Division of the NPS and was inspired to work towards employment with them one day. The background of this map shows 91 different field sites from Oregon to Texas with a focus on California locations, particularly a transect of the Santa Monica Mountains National Recreation Area and Channel Islands National Park and a transect along the High Sierra Trail in Sequoia- Kings Canyon National Park.

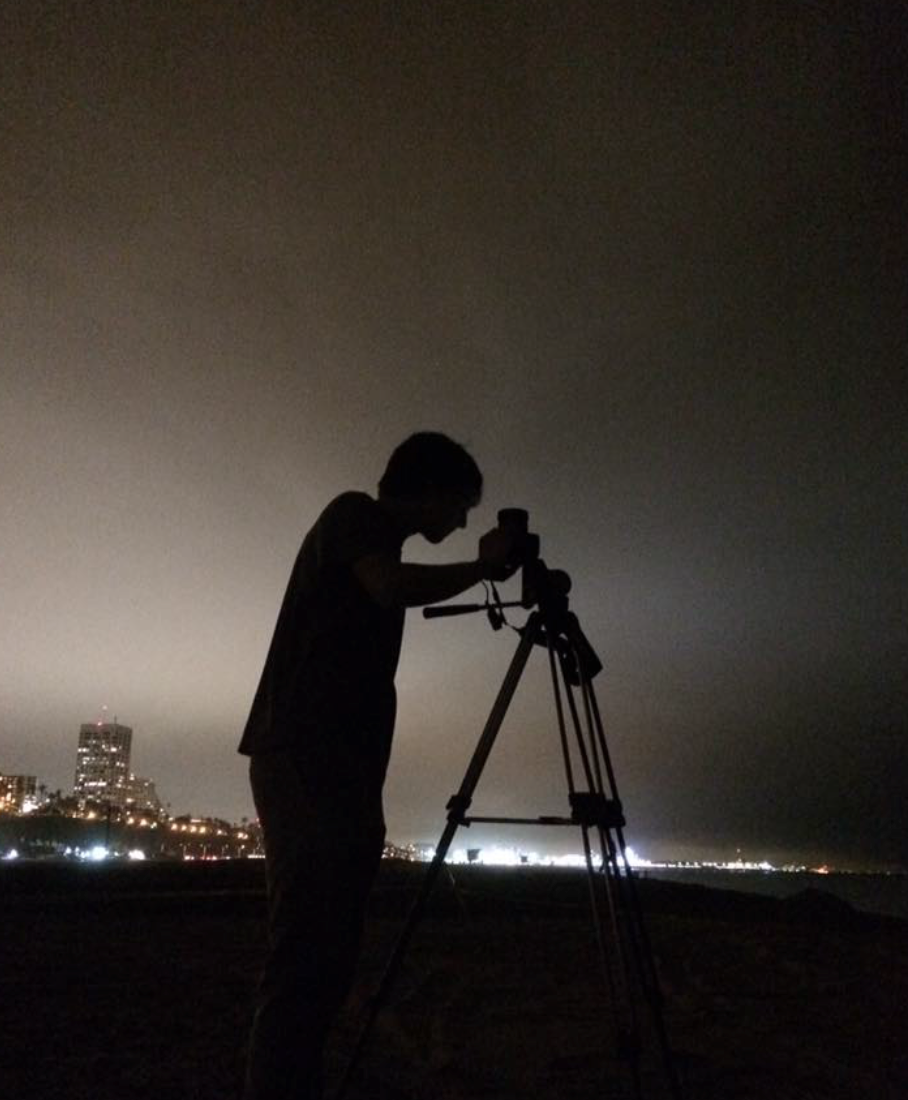
Setting up the fisheye camera on the sandy beach north of Santa Monica Pier to better measure impacts from artificial light on urban beaches.
Coast light
This study focused on assessing the range of nocturnal illumination experienced at the shoreline across Ventura, Los Angeles, and Orange counties. I conducted the initial fieldwork to provide proof of concept by sampling dozens of sites in the Santa Monica Mountains and Channel Islands. I also digitized polygons for every acre of sandy beach in Los Angeles County in ArcGIS Pro for analysis of grunion habitat. This project had a multifaceted approach using both GIS, ground-based photography, and remote sensing images to assess the primary question:
Do ambient light conditions affect the geographic distribution of use of the urban coast by sensitive species such as Western Snowy Plovers and California Grunion?

Google Maps satellite image showing Doe Run Co’s Amax Tailing Pond below the Buick Mine and Mill above Strother Creek which had elevated lead and heavy metal concentrations compared to Little Creek with no upstream mining activity.
Lonigro Award- High School Research
The Lonigro Award is presented to the high school senior at St. Louis University High School who has most distinguished themselves in the study of science. My project measured lead levels in streams and organic detritus in the Ozark Mountains comparing watersheds with large open pit lead mines upstream and those in Mark Twain National Forest with minimal development. Lead levels were significantly elevated below mines even after industrial remediation release water from tailing ponds into streams. Anecdotal evidence from talking to locals confirmed a lack of biodiversity in these streams compared to ones just one drainage over. Samples were collected in the field and analyzed by atomic flame spectroscopy in the Cor Jesu science lab with the help of Bill Joern.

Using radio telemetry to track urban box turtles in Forest Park, St. Louis, MO in 2013.
St. Louis Box Turtle Project
Through Washington University’s Tyson Research Institute, I got to be involved in a box turtle telemetry project the summer between my junior and senior year of high school. This experiences was foundational in my interest in GIS watching my mentor calculate box turtle home ranges in ArcMap and learning that urban and rural box turtles had significantly different sized home ranges based on their habitat constraints.